|
|
About iCT-M
Implementing ICT-M
Real-Life iCT-M Implementation
|
|
|
The real-life implementation requires application of many process improvement tools
to identify, execute and close projects. In modern businesses, these tools are nearly
always computer aided and while much excellent software exists, many are independent
applications that must be managed in terms of data file storage and retrieval. In
most software, files created by the software are saved as in some directory. This
directory is often only available to that particular user. Although network directories
may ease this file sharing somewhat, the data interchange is still lacking. When
a project requires several application tools (e.g. Pareto Analysis, Histogram, etc.)
tools undertaken by different team members are saved in their respective hard disks.
For a manager, this means having to ask for project status from the team members.
In fact, the manager has little say over the management of the data or knowledge.
The inability of management to control this knowledge is a great loss to companies.
In future undertakings, knowledge lost with the movement of employees has to be
relearned - reinventing the wheel, while the competition marches on. |
 |
|
The new iCT-M software for productivity and quality improvement works rather differently.
With iCT-M, files and data are managed collectively and without the user having
to remember where those files and data are store. iCT-M allows practitioners to
carry out projects in two distinct ways: checkerboard or storyboard. Project leaders
can conduct several projects and open each project element as a dynamic applet.
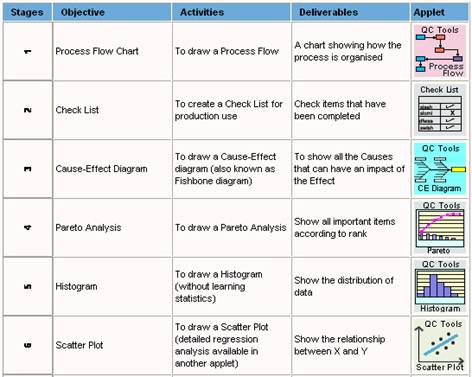
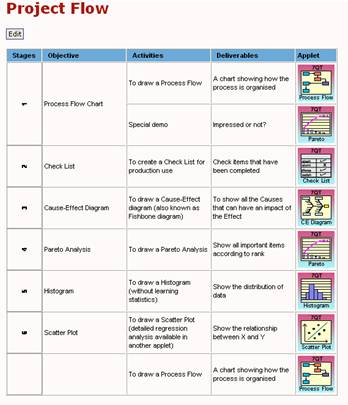
Consider a team working on Reducing Forming Defects. There are many tools and techniques
which are required in this problem solving process. These activity tools organized
as a checkerboard may look as follows. |
|
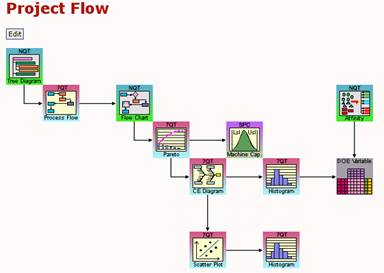
Checkerboard Project Flow |
Storyboard Project Flow |
 |
 |
|
The reader may recognize many of these icons. Icons are related to an application
so that clicking on a icon invokes that application. With either of the checkerboard
or storyboard. structures, practitioners need not worry about file and data storage
or retrieval. Additionally, the project flow of applications is unlike any other
software. With iCT-M's structure, the natural progression is inherent and practitioners
can see the logical development of a project from its early stages. With iCT-M new
icons can be inserted and unwanted icons can be deleted. This dynamic system allows
practitioners to modify their project plan as new information is received. |
|
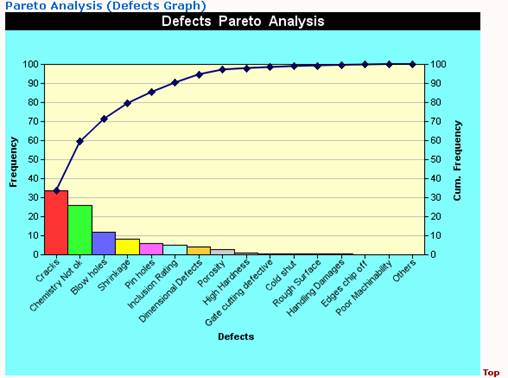
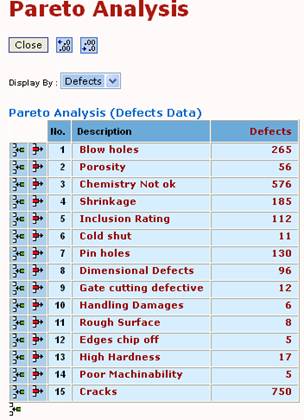
Once a board is created, the user can click on an applet to invoke that tool.
For example, clicking on Pareto will open a dialog page as follows. This page has
an insert/delete row function. The user enters as many rows as possible and the
number of defects or other quantity. There is an option to consider the Pareto Analysis
by the number of defects or by cost. Once the user clicks Close, The Pareto chart
is drawn as follows. |
 |
|
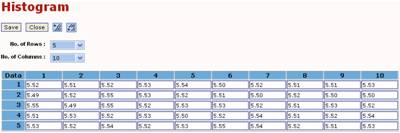
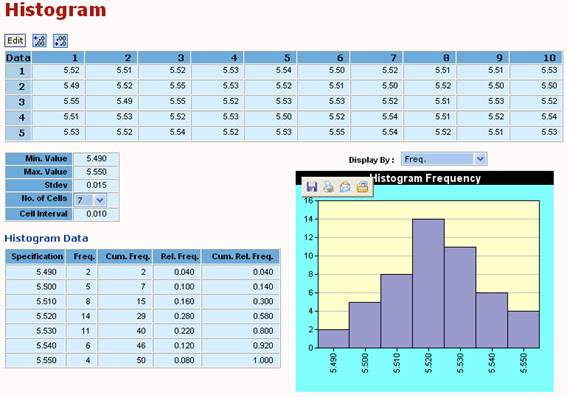
After the Pareto Analysis is completed, the user can move to the next applet by
clicking on another applet in the project flow, such as the Histogram, shown below.
Once again, clicking on the Histogram icon invokes the Histogram application. An
appropriate dialogue page appears and the user need only enter the data.
|
 |
|
At first sight this series of activities may appear somewhat insignificant considering
much software that can perform very detailed data analysis. However, consider for
example, how a very ardent user may conduct a Design of Experiments, all be it,
a simple 2^3 (or otherwise an L8 (2^(7-4) i.e. 1/16 fractional factorial of 2^7).
Already the jargon may put most users into a state of limbo. This is precisely where
iCT-M holds the rein. iCT-M provides 21 pages of simple step by step pages that
takes the user through the experiment without demanding (almost) any statistical
knowledge. Nowhere does iCT-M ask for the confounding relations, number of replication
or repetitions. Even the best software in the field does not consider the quality
loss function when in fact any basis of experimentation, or indeed and quantification
of experimental success, must involve a bottom-line measure, almost invariably,
COST! Not many software do this. Unlike iCT-M. |
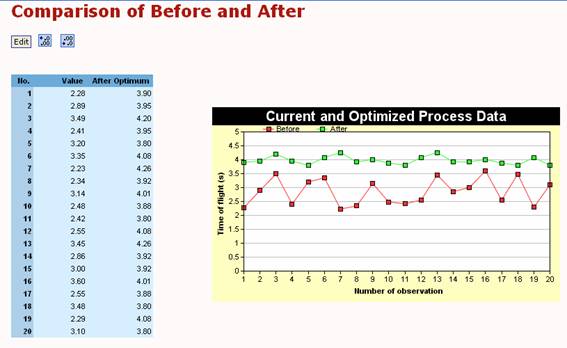
Conducting the Experiment
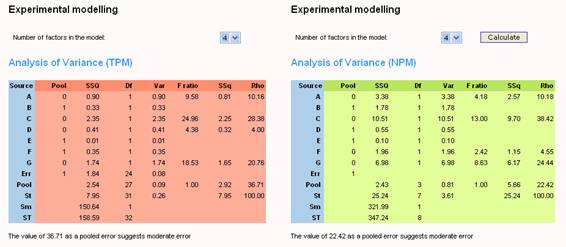
Conducting an Analysis of Variance
Displaying the process improvement
|
|
Because of the complexity of most applications, and the mathematic or statistic
detail required to perform most productivity and quality improvement tools and techniques,
most users are not excited about conducting say, Measurement System Evaluation (MSA).
With iCT-M, anyone who understands the basics of what MSA is about can conduct a
study of MSA. Indeed, with over 150 tools and techniques, including 7 QC Tools,
New QC Tools, Advanced QC Tools, Voice of Customer, Quality Function Deployment,
Failure Mode Effect Analysis, Statistical Process Control, Advanced Statistical
Techniques, Measurement System Analysis, Hypothesis Testing, Design of Experiments,
Control Plans, Dynamic Control Plans, Production Part Approval Process, etc. Clearly,
iCT-M is the new standard of productivity and quality improvement tools and techniques. |
|