|
|
Analytical Techniques
ANALYTICAL TECHNIQUES
|
By Dr. Nicolo Belavendram
Design and Production, Faculty of Engineering, University of Malaya
|
|
For APQP:
Note that while the phases 1-4 have input - output relationships, this is not usually evident as a direct line.
Appendix B in the Automotive Industry Action Group's, (AIAG) APQP Reference Manual suggests many different tools and techniques that may be used in APQP.
For Six Sigma:
Note the DMAIC methodology is not usually evident as a direct line.
Many different tools and techniques may be used in Six Sigma.
To the extent that direct lineation cannot be drawn the process is subject to inter-linking. Thus, if one document is updated there is every change that another related document is not updated. Here, iCT-M software can be of great assistance.
Many of these tools and techniques require much training and resources. With iCT-M, employers can empower employees to tackle a large number of applets (tools and techniques) including the following:
|
 7QCT: Seven Quality Control Tools 7QCT: Seven Quality Control Tools
Process Flow Chart, Check List, Cause-Effect Diagram, Pareto Analysis, Histogram, Scatter Plot, SPC
|
NQCT: New Quality Control Tools
Advanced Flow Chart, Affinity Diagram, Characteristics Matrix, Organization Chart, Tree Diagram, Force Field Diagram, Before After Graph, Pareto Comparison, Simple Gantt Chart, Gantt Chart
 |
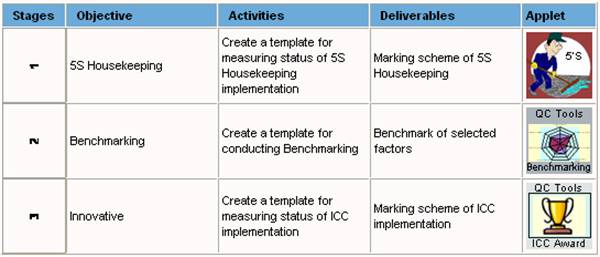
AQCT: Advanced Quality Control Techniques
5S Housekeeping, Benchmarking, Innovative Creative Circles
|
VOC: Voice of Customer
Things Gone Right, Things Gone Wrong, Voice of Customer,Kano Analysis
|
QFD: Quality Function Deployment
Quality Matrix (shown left below), Function Matrix (shown right below), Quality-Function Matrix, Production Matrix, Concept Selection, Service Matrix
  |
FMEA: Failure Mode Effects Analysis
Product, Process, Product & Process, Production
 |
SPC: Statistical Process Control
Machine Capability, Pre-Control Chart, XBar-Sigma Chart, XBar-Range Chart, XInd-RMov Chart, XMov-RMov Chart, Median Chart, d Chart, p Chart, c Chart, u Chart
 |
AST: Advanced Statistical Techniques
Frequency Chart, Sampling by Code, Single Sampling Plan, Double Sampling Plan, Acceptance Sampling, Online Quality Control, Weilbull Curves, Constant-Wear, Wear-Out, Failure Pattern, Accelerated Tests, Product Reliability Studies
 |
MSA: Measurement Systems Analysis
Bias, Linearity, Stability, GRR (Short Term), GRR (Long Term), GRR (Anova), GRR (Attribute), Measurement System Evaluation
 |
HYP: Hypothesis Testing
z-Test, t-Test 1 Sample, t-Test 2 Sample, t-Test Paired, One Proportion, Two Proportion, Anova 1 Factor, Anova 2 Factor, Chi-Squared Goodness Of Fit, Chi-Squared Test Of Independence
 |
DOE: Design of Experiments
Variable, Idle Column, Nested Factor, Operating Window, Combination Column, Attribute
 |
CPM: Control Plan Methodology
Prototype Control Plan, Pre-launch Control Plan, Production Control Plan
 |
DCP: Dynamic Control Plan
Proto-type Dynamic Control Plan, Pre-launch Dynamic Control Plan, Production Dynamic Control Plan
 |
PPAP: Product Part Approval Process
APQP Checklist, FER Checklist, Retent-Submit, Part Submission Warrant, Appearance Approval Report, Dimensional Results, Material Test Results, Performance Test Results, PPAP
 |
|


