Multivariate Analysis software and consultancy - Multivariate Analysis technique examines the relationship between several categorical independent variables and two or more metric dependent variables.
|
Multivariate Analysis - Optimization
|
Principal Component
|
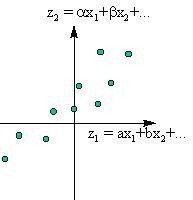 |
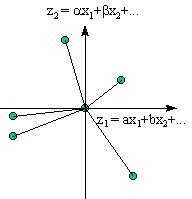
Principal Component is designed to reduce the number of variables that need to be considered to a smaller number of indices called the principal components. Principal components are linear combinations of the original variables. This method provides an objective way of finding indices so that the variation in the data can be accounted for as concisely as possible. It may well be that two or three principal components provide a good summary of all the original variables. Consideration of the values of the principal components instead of the values of the original variables may then make it much easier to understand the data.
Principal Components allows you to:
- Identify the importance of each variable in your experiment
- Reduce from a large number of variables to a few important components
- Investigate special relationships between major components
|
|
|
|
Factor Analysis
|
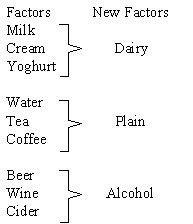 |
Factor Analysis attempts to account for variation in a number of original variables using a smaller number of factors (also called index variables). It is assumed that each original variable can be expressed as a linear combination of these factors (plus a residual term) that reflects the extent to which the variable is independent of the other variables. One type of factor analysis starts by taking a few principal components as the factors in the data being considered. These initial factors are then modified by a special transformation process called factor rotation to make it easier to interpret the data. Other methods for finding the initial factors are also used. A rotation to simpler factors is almost always possible.
Factor Analysis allows you to:
- Identify the importance of each variable in your experiment
- Reduce from a large number of variables to a few components
- Rename components into more meaningful new factors
- Investigate special relationships between new factors
|
|
Discriminant Analysis
|
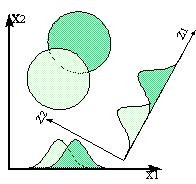 |
Discriminant Analysis is concerned with the possibility of separating different groups on the basis of available measurements. Like principal component analysis, Discriminant analysis is based on finding suitable linear combinations of the original variables.
Discriminant Analysis allows you to:
- Investigate your data
- Separate dissimilar variables from a mixed group of variables
|
|
Cluster Analysis
|
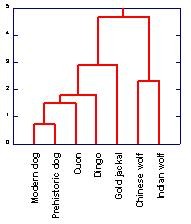 |
Cluster Analysis is used to identify groups of similar individuals. More importantly, cluster analysis allows you to see a meaningful relationship between the variables that are studied.
Cluster Analysis allows you to:
- Measure the distances between several groups of items
- Relate groups of variables into their closest relationships
- See how an item of interest is related to the rest
|
|
Canonical Correction
|
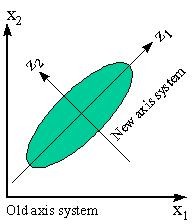 |
Canonical Correlation divides variables into two groups and the interest is to find the uncorrelated relationship between the groups. Canonical Correlation allows you to: Change the axis system for group of variables into a new axis system The system can now be investigated on the improved new scale
|
|
Multi Dimensional Scaling
|
 |
Multi Dimensional Scaling is used to create a "map" showing how individuals are related. The method starts with data on some measure of the distances apart of a number of individuals. Using these data, a map is constructed showing how the individuals are related. This method is very useful because it provides a measure of "distance" without having any idea of how the objects are related in a geometric sense. Multi Dimensional Scaling allows you to: Map relationships between variables See how an item of interest is related to the rest
|
|


