|
|
QYP - Quality Yield Productivity (Single Line)
QYP - Quality Yield Productivity (Single Line)
QYP - Quality Yield Productivity (Single Line) - Quality Yield Productivity is a process of calculating the amount of accepted products from the given input to the machine/machines or process/processes.
|
Quality Yield Productivity (Single Line) - Track your productivity and monitor your output on a daily, monthly or process wise to know your cycle time.
|
|
|
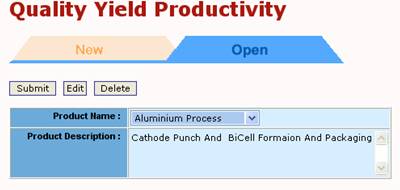
1. Select Product
|
|
Select Product:
QYP-SL stands for Quality Yield Productivity - Single Line. This application tracks a product line in which a product moves from one process to the next linearly.
In Select Product, a user can add a New product or Open and existing one. A product description can also be added.
iCT-M allows many product lines to be monitored at the same time. When there are many product lines, they can be selected from the Product Name dropdown box.
|
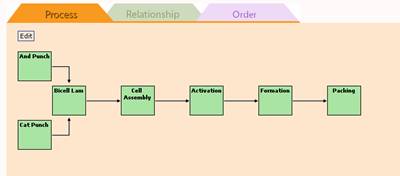
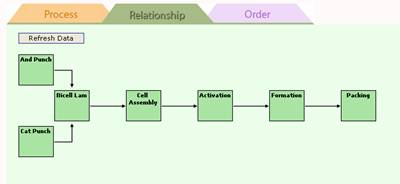
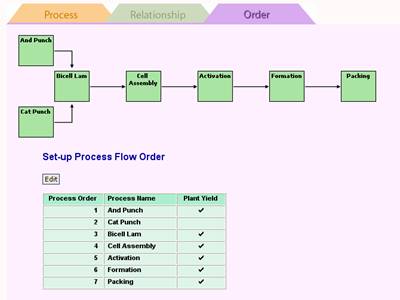
2. Define Process
3. Schedule
|
|
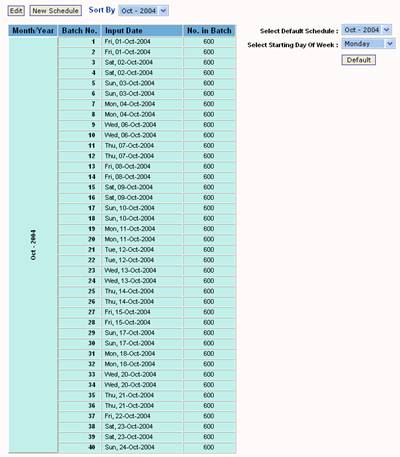
Schedule:
In this page, the user enters the Schedule for the product. This is the number of parts that are to be processed.
Since a product can be over a long period of time, the Select Default Schedule is used to select the active time period.
Select Starting Day Of Week allows the user to set the start day of the week.
|
4. Throughput
|
|
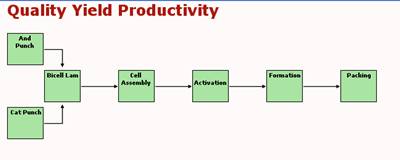
Throughput:
Once a process has been defined, entering the Quality, Yield and Productivity data is simple.
Just click on any of the process box and enter the data.
Normally, only data for a given day would need to be entered by a supervisor. Once this is done, it is possible to get real-time updates on many aspects of the production.
|
5. By Date
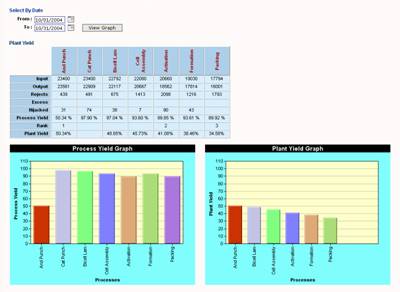 |
By Date:
This is a report of the production By Date. Select By Date From and To by clicking on the calendar icons. Then click on View Graph.
The Process Yield Graph shows the yield at each process for the selected date range.
The Plant Yield Graph shows the cumulative yield up the process for the selected date range.
|
 |
Although iCT-M is not an Enterprise Resource Planning software, it does great graphics of showing Process and Plant Yield very easily.
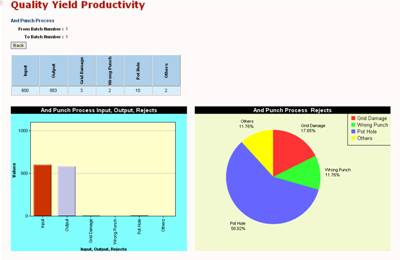
Clicking on any of the process names in the table above gives a breakdown of the defects in that process. Continuous Improvement may be required to reduce a particular defect type. Here, iCT-M allows the user to chain to the Projects module and initiate a project on the defect reduction. Click here to see how this is done.
|
6. By Batch
|
|
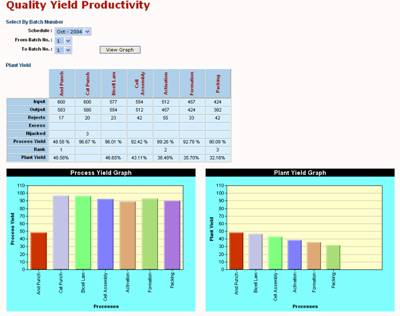
By Batch:
This is a report of the production By Batch. Select the Schedule, From Batch No. and To Batch No.. Then click on View Graph.
The Process Yield Graph shows the yield at each process for the selected Batch Numbers.
The Plant Yield Graph shows the cumulative yield up the process for the selected Batch Numbers.
|
 |
Although iCT-M is not an Enterprise Resource Planning software, it does great graphics of showing Process and Plant Yield very easily.
Clicking on any of the process names in the table above gives a breakdown of the defects in that process. Continuous Improvement may be required to reduce a particular defect type. Here, iCT-M allows the user to chain to the Projects module and initiate a project on the defect reduction. Simply amazing. Click here to see how this is done.
|
7. By Process
|
|
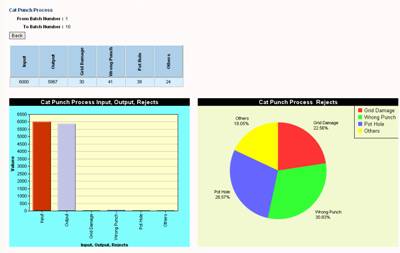
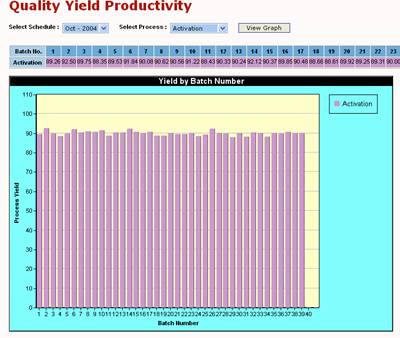
By Process:
This page shows the defect level at each process. Detail yield for any batch is available. If a batch is "lost" in the production line, no update is possible and the batch will show as not found in the next process. This is an important way how an inactive batch can be spotted immediately.
Yields can also be seen as a cumulative graph when viewed by All processes.
|
8. Daily Performance
|
|
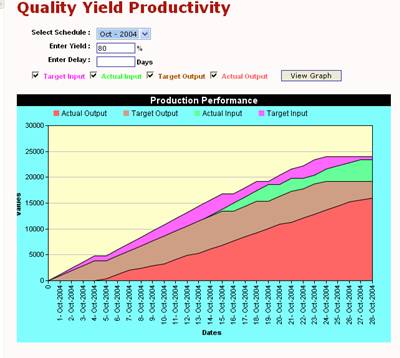
Daily Performance:
This page shows the Daily Performance. Various views are possible. For example the user can compare
- Target Output vs. Actual Output
- Target Input vs. Actual Input
- Actual Input vs. Actual Output
- etc
On a day-by-day basis, the deviations are shown clearly.
|
9. Monthly Performance
|
|
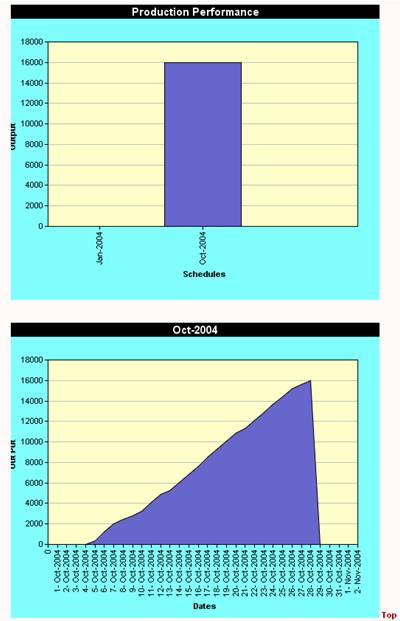
Monthly Performance:
When QYP-SL is user over several months, the Productivity for the several months can be shown graphically.
Another graph shows the productivity breakdown for the selected month.
|
10. Output
|
|
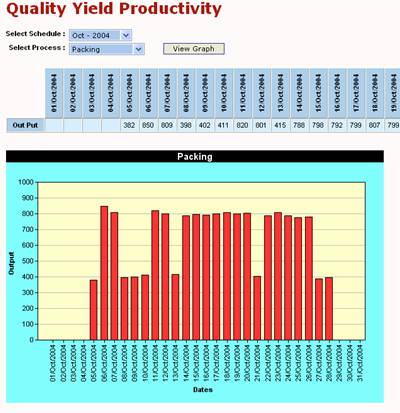
Output:
Since, the final Output is an most important consideration in any production, this page shows the Output by Process over the dates of the month. Thus, this graph will show days of low or high productivity.
|
11. Cycle Time
|
|
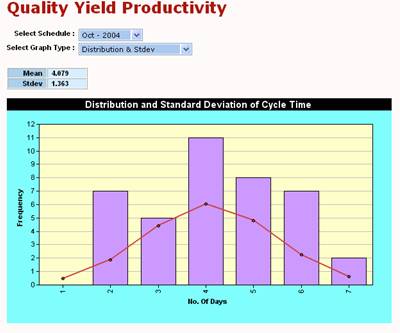
Cycle Time:
This page is a great page that calculates the overall cycle time (duration of time between starting to finish) of a product. iCT-M does this without requiring any other data entry nor does it require a cycle time study. Additionally, the cycle time is based on the entire production and is therefore a very good estimate of the true cycle time rather than a sample study.
|
12. Score Card
|
|
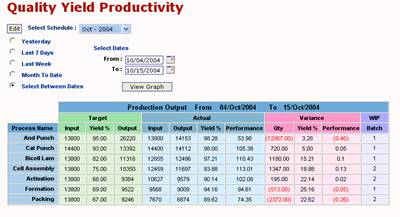
Score Card:
Finally, the Score Card gives a summary of the Target, Actual and Variance of the production on selected date ranges. This is a useful tool for manufacturing supervisors to see production progress.
|
|
|