|
Reducing Negative Impact of Noise Factors on Product Design Performance Using Statistical Design of Experiments
|
|
Zalina Abdul Aziz 1 , Lim Chee Peng 1 , Norhashimah Morad 2 , Wang Shir Li 1
|
1 Intelligent Quality Engineering System (i-Quest) Research Group
School of Electrical and Electronics Engineering
University of Science Malaysia , Engineering Campus
14300 Nibong Tebal, Seberang Perai Selatan, Pulau Pinang , Malaysia
E-mail(corresponding author): zalina@eng.usm.my
|
|
2 School of Industrial Technology
Universiti Sains Malaysia, Main Campus
11800 Minden, Pulau Pinang, Malaysia
|
|
Abstract
|
|
An essential aspect in the creation of products that are able to perform its intended function is the development of ‘robust product designs'. The latter refers to product designs which will result in products whose performances are less sensitive to factors which are hard or impossible to control during the manufacturing stage of the product development cycle or during the actual operation of the products by customers. Such factors are referred to as ‘noise factors' in this paper.
A strategic approach based on the use of statistically designed experimental methods during product design that incorporates knowledge of noise factors as well as investigation of countermeasures for noise factors is proposed in this paper. This involves the selection of levels (or settings) of design factors that makes the product performance less sensitive to the noise factors. An actual application by the authors is presented in this paper.
|
|
Keywords: robust product design, robust parameter design, statistically designed experimental methods, control by noise interaction
|
|
Introduction
|
|
In this paper, the authors present an actual application of robust product design. The origin of the term ‘robust product design' and the approach employed to achieve it are also covered in this paper. A glove manufacturing facility in Malaysia collaborated in the above-mentioned application.
The approach, known as ‘robust parameter design', employs statistically designed experimental methods and was developed only in the late 1980s. Despite its late development, robust parameter design has been recognized as a formal engineering design tool.
Actual case studies have demonstrated that the use of robust parameter design enables engineers to economically and efficiently develop product designs that are insensitive to the various uncontrollable sources of variation that affects the performance of the product [1, 2, 3].
|
Background
|
|
Definition of Robust Product Design
|
|
|
It was Professor Genichi Taguchi who first used the term ‘robust product design' to refer to products that perform consistently on target and are relatively insensitive to factors that are difficult to control. Such factors are almost always present during the manufacturing process and customer use conditions. Figure 1 shows a generic approach to designing products; product manufacture and use of the product by the customer being the final stages of this cycle.
|
Noise versus Control Factors
|
|
Taguchi makes the following distinction regarding the factors that affect the performance of the product; while some of the factors can be easily set and maintained, there are also factors that are difficult to control or set to a constant value. Taguchi uses the term ‘control factors' and ‘noise factors' to refer to these two types of factors respectively.
Examples of noise factors during manufacturing are: process parameters which cannot be precisely controlled such as machine tool vibration; poor quality raw material and components from vendors; and fluctuating environmental factors such as humidity, temperature, and dust levels. Examples of noise factors during customer use conditions are: various operating voltages, differences in the skills of the customers, and varying weather conditions due to the customers' geographical locations.
Noise factors can create the following negative effects on product values, and thus on product design performance: the product values may not be centered around the desired nominal value such as a circuit's output may not be centered around the desired value of 10 volts; there may be erratic fluctuations of the product values causing the product tolerance to be wide; or both these instances may occur. In any case, any of the above three instances will cause the product to fail to perform its intended function consistently over its lifetime.
Control factors include the design parameters (design factors) in the earlier processes in Figure 1; mainly the product design and manufacturing system design processes.
|
Approach
|
|
Robust Parameter Design
|
|
Robust parameter design, or parameter design for short, was pioneered by Taguchi [4, 5]. The aim of parameter design is to reduce the performance variation of the product by choosing the setting of its control factors which will make the product less sensitive to the variation that is induced by noise factors (or noise variation). Taguchi intended parameter design to be an alternative to the use of expensive measures for reducing noise variation such as the use of higher grade raw material and components, installation of expensive devices for controlling environmental fluctuations, and more frequent inspection of the finished product.
Parameter design employs statistically designed experimental methods to plan out and conduct experiments in order to investigate the significance of noise and control factors on product performance, as well as the interactions between them. The experimental results can be analyzed using graphical means such as interaction plots or formal statistical tests such as analysis of variance and residual analysis. Fractional factorial designs; also known as orthogonal arrays, is the most commonly used statistically designed experimental method in parameter design.
|
Fractional Factorial Designs
|
|
Fractional factorial designs enable a large number of factors to be investigated in a single experiment by conducting a fraction of the total number of possible runs [6]. For instance, suppose an experiment involves six factors, each at two levels. The total number of possible runs is 64. Using fractional factorial designs, only thirty-two or a half fraction of the total number of runs may be conducted.
The number of runs to conduct depends on factors such as the amount of resources that is available and the resolution of the fractional factorial design (design resolution). The latter refers to the degree of unambiguity that is desired in the experimental conclusions. In the example in the preceding paragraph, the design resolution is VI. This means that the significance of all factors as well as two-factor interactions between all pairs of noise and control factors can be investigated. In this case, the notation for the fractional factorial design is 2 VI 6-1 .
In an actual application by [1], only sixteen runs were required to investigate eight control factors and two noise factors. The objective of the application was to determine control factor settings that would minimize non-uniformity of the epitaxial layer on silicon wafers in the presence of noise factors while maintaining average thickness as close to the target value as possible.
|
Control by Noise Interaction
|
|
|
A control factor is said to interact with a noise factor if the effect of the variation in the level of the noise factor on product performance is dependant on the level of the control factors. Interaction plots of the experimental results, such as those in Figures 2 to 7, can be generated to provide evidence of the absence or presence of interaction. Plots with approximately parallel lines are indicative of a lack of interaction. Non-parallel lines such as lines which cross each other indicate otherwise. Knowledge of the presence or absence of interaction can be exploited in order to provide insights on the preferred levels of control factors. The next section illustrates this.
|
Methodology
|
|
|
The methodology for using robust parameter design is illustrated in this section based on an experiment carried out [3].
|
Experimental Background
|
|
|
The experiment was aimed at improving the performance of a prototype machine vision system for the inspection of rubber gloves. One of the product performance measures that was of interest to the glove manufacturer was the finger length of the gloves. Six control factors (A, C, D, E, F, G) and one noise factor (B) were selected for the experiment. The factor levels are as shown in Table 1.
|
Table 1: Experimental Factors and Levels
|
|
Factor
|
Low ( -1)
|
High (+1)
|
|
A - aperture size
|
1.2
|
2.5
|
|
B - operator skill
|
low
|
high
|
|
C - binarization threshold value
|
30
|
80
|
|
D -angle threshold value
|
-0.95
|
-0.55
|
|
E - camera focus
|
1.5
|
5.0
|
|
F - Sobel edge detector, gradient magnitude, threshold value
|
0
|
510
|
|
G - lighting mode
|
ambient
|
additional
|
|
Experimental Design
|
|
Thirty-two runs were conducted. A 2 IV 7-3 fractional factorial design was used. The runs corresponded to a quarter fraction of the total number of possible runs. All two-factor interactions between noise factor B and the control factors were investigated.
The runs were carried out in a random manner. The length of the little finger (in pixel) of a single rubber glove was measured for each run. The actual length was 51 pixels.
|
Analysis
|
|
|
In this paper, the experimental results are analyzed using interaction plots as shown in Figures 2 to 7. The average finger length at the low and the high level of factor B are plotted against the low and high level of the control factors.
|
Discussion
|
|
There is evidence of interaction between factor B and the control factors. Therefore, when factor B varies, its effect on average finger length depends on the level of the control factors. For instance, in Figure 3, with C at the high level, factor B has little effect on average finger length. However, with C at the low level, the average finger length at the low and high level of factor B differs.
Based on the interaction plots, the recommended control factor levels for obtaining the targeted finger length reading of 51 pixels are shown in Table 2.
|
Table 2: Recommended Control Factor Levels
|
|
|
Noise Factor B
|
|
Control Factor
|
Low
|
High
|
|
A
|
High
|
High
|
|
C
|
High
|
High
|
|
D
|
Low
|
Low
|
|
E
|
Low
|
Low
|
|
F
|
High
|
Low
|
|
G
|
Low is slightly better
|
High
|
|
It can be seen that the recommended control factor levels depend on the level of factor B. For the case of the glove manufacturer, it is possible for the manufacturer to detect when the different levels of factor B exist in the process.
|
Conclusions
|
|
The above case study has demonstrated that valuable insights regarding interaction between noise and control factors can be obtained using robust parameter design. Thus, during the product design stage, consideration of all possible noise factors arising from manufacturers' and customers' environment is critical. This should be followed by the inclusion of noise factors in robust parameter design and finally the selection of appropriate control factor levels.
In this way, the quality and reliability of products can be assured when used by customers. The need for manufacturers to institute costly measures in order to reduce the negative impact of noise factors on product design can then be eliminated.
|
|
|
Figure 1- Generic representation of product development cycle
|
|
|
|
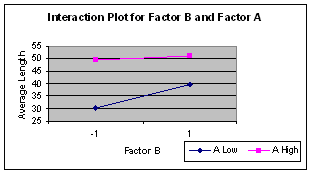
Figure 2 – Interaction plot for factor B and A
|
Figure 3 – Interaction plot for factor B and C
|
|
|
|
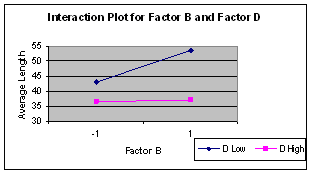
Figure 4 – Interaction plot for factor B and D
|
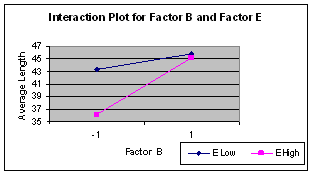
Figure 5 – Interaction plot for factor B and E
|
|
|
|
|
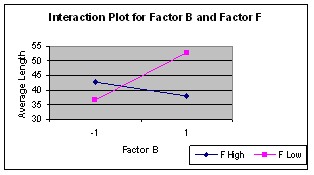
Figure 6 – Interaction plot for factor B and F
|
Figure7– Interaction plot for factor B and G
|
|
Acknowledgements
|
|
|
The authors would like to thank Universiti Sains Malaysia for supporting this work in the form of research grant # 6036047.
|
References
|
|
[1] Kackar, R.N. and Shoemaker, A.C. (1986), Robust Design: A Cost-Efffective Method for Improving Manufacturing Processes, AT&T Technical Journal, 65, 39-50.
|
[2] Pignatiello, J.J., Jr. and Ramberg, J.S. (1985), Discussion of ‘Off-Line Quality Control, Parameter Design, and the Taguchi Method by Kackar, R.N., Journal of Quality Technology, 17, 198-206.
|
[3] Oh, S. H. (1995), Quality Control and Machine Vision System, Final Year Project Report, Quality Control and Instrumentation Program, Universiti Sains Malaysia .
|
[4] Taguchi, G. (1986), Introduction to Quality Engineering, Tokyo , Japan : Asian Productivity Organization.
|
[5] Taguchi, G. (1987), System of Experimental Design, White Plains , NY : Unipub/Kraus International Publications.
|
|
[6] Montgomery, D. C. (2001), Design and Analysis of Experiments, 5 th edition, NY: John Wiley & Sons.
|