|
|
QFD
|
Gerald M. Katz, "After QFD: Now What?", PDMA Visions magazine, April 2001, Vol. XXV, No. 2. (Also see pdma.org)
|
|
After QFD: Now What?
|

Gerald M. Katz, Executive Vice President, Applied Marketing Science, Inc.
gkatz@ams-inc.com
|
|
Quality Function Deployment (QFD), the well-known Japanese product development methodology, has been kicking around the western world for almost 15 years now. And like most alleged "managerial miracle cures" (panaceas!), it has now amassed large armies of both supporters and detractors. After some dramatic early victories, followed by some equally dramatic but perplexing failures, interest in QFD seemed to wane in the early 1990s. But recently there has been a resurgence of interest in its use, with commonplace applications in both consumer and business-to-business products that go well beyond the original automotive world (which was QFD's bread and butter in the early years).
For instance, there have been numerous presentations at professional conferences in the last few years of cases where QFD was used in aerospace, software, medical devices, telecommunications products, and even bakeries (bagels and muffins). And many non-industrial organizations are now making extensive use of QFD for the development or refinement of services, processes, and programs, e.g., hospitals, hotels, architectural design firms, educational institutions, gas and electric utilities, and even entertainment industry companies such as theme parks.
|
|
Background
|
|
QFD is typically carried out by a cross-functional team of individuals who have been charged with responsibility for developing a new product, service, or process, or for refin-QFD originated in a Japanese ship-building firm in the early 1970s and was first codified in the Japanese academic world by Drs. Yoji Akao and Shigeru Mizuno in their groundbreaking book, Facilitating and Training in Quality Function Deployment (1978). QFD was then adopted by the Japanese auto industry in the early 1980s, and migrated to the U.S. auto industry by the mid-1980s. From there it was picked up by the manufacturers or developers of virtually every type of product and service imaginable. Bob King is generally credited with having written the first complete English-language book about QFD ‹ Better Products in Half the Time (1987). And John Hauser and Don Clausing of MIT were instrumental in popularizing QFD in their 1988 Harvard Business Review article, The House of Quality.
QFD is typically carried out by a cross-functional team of individuals who have been charged with responsibility for developing a new product, service, or process, or for refining an existing one. The team goes through a process of filling in a large matrix known as The House of Quality (in view of its shape) which catalogues a complete set of customer needs (The Voice of the Customer), which become the names of the rows, and system design metrics, which become the names of the columns. These columns have been called many things over the years Engineering Characteristics, Technical Quality Characteristics, Quality Specifications, Functional Requirements, The "Hows", etc. My own preference is to use the phrase Performance Measures as the most broadly applicable and intuitive for all kinds of applications whether they be products, services, or processes. These Performance Measures do, indeed, become the design specifications for the new product or service. When completed, the matrix calculations are used to reorder and prioritize these design specifications, directing the development team to concentrate their efforts on those specs that really matter most in satisfying customer needs. An important side benefit of the QFD process is that it forces the team to think creatively about how to solve various system design problems and which metrics to put in place to be sure that they are evaluating their progress correctly.
|
|
But All Is Not Well
|
|
Sounds good, so far. But unfortunately, QFD does not always leave its participants with that "warm and fuzzy" feeling that one might hope for and expect. First there is the issue of tedium. To this day, many teams still report that they find the process unbearably time-consuming, even though there are now dozens of good facilitators who are finding more efficient ways to facilitate teams through the process in less time and with less of a sense of "wandering in the desert." Fortunately, despite the tedium, most teams still report that the QFD process was clearly worth the pain that is, they gained tremendously useful insights and ended up with better new product and process designs than they would have otherwise.
|
|
But one even bigger problem seems to plague even the most successful QFD applications. The problem of What to do when you finish? That is, After QFD . . . now what?
|
|
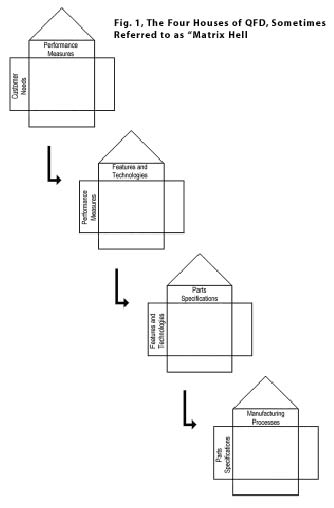
The conventional wisdom has always been to simply "Build more houses." Traditional QFD theory argues that QFD is actually a series of four (or more) matrixes, not just the initial House of Quality matrix. In this formal, (and to some overly academic) approach, the first House starts with an initial set of customer needs (on the lefthand side of the matrix), which are then used to generate and prioritize a set of Performance Measures (across the top of the matrix). (See Fig. 1) Then, for the second House, participants take the most important Performance Measures from the first House, and list them down the side of a new matrix. This second House is then used to generate a set of Features, Technologies, Programs, or Actions which are chosen to address the Performance Measures. Then the team takes the winning Features, Technologies, etc., from that matrix and begins yet another matrix. This third matrix is then used to generate Parts Specifications, and then Manufacturing Processes, and so on and so on and so on (see Figure 1). The theory is that QFD should be used to "deploy" the Voice of the Customer throughout the product development process. QFD purists often insist that, if you are only doing the initial House of Quality, you are not really doing QFD.
|
|
In my experience, while this view is technically correct, as a practical matter, it is highly unrealistic. The initial House of Quality usually takes anywhere from two to six full days of intensive team meetings, and no matter how well the facilitator has streamlined the process, the team is usually exhausted and eager to get back to their regular job responsibilities (which haven't gone away while they were involved with the QFD). Or they may just be eager to get on with the actual design work and implementation. A few of the teams I have worked with have insisted on doing a second house (or a Pugh Concept Selection Matrix which is just a variation of the second house). In most of these cases, in hindsight, these teams felt that 80-90% of the learning had occurred during the initial house and that the second house had probably not been worth the added time and effort.
|
|
Some Answers
|
|
So, if the answer is not to "build more houses" (which one participant once described as "being locked in matrix hell."), what should a team do after completing an initial House of Quality matrix? In the dozens of cases that I have facilitated or been involved with, I have seen a number of approaches ranging from very straightforward to highly complex. Many of these have proven to add real value to the QFD process as usually practiced. In all of these approaches, the underlying objective is to organize the performance measures in a way that appropriately focuses the organization's attention on the "right" priorities as identified by the matrix: finding engineering solutions, acquiring needed skills and technologies, solving problems, taking actions, starting programs, changing policies, putting new systems in place, etc. Here is a sampling of these approaches from the simplest to the most elegant:
|
|
1. Choose a subset of the performance measures to concentrate on.
|
|
The most obvious way to do this is simply to choose the top "n" measures (where "n" is usually somewhere between 15 and 20). Since a typical House of Quality matrix has about 15-25 rows and 40-60 columns, "n" usually represents somewhere in the neighborhood of one quarter to one half of the total. Most teams just use their intuition to decide on the cutoff, while also looking further down the list for what is often deemed "the low hanging fruit," i.e., those measures which, though not the most critical, may be worth working on because they are easy to address. For instance, an electric utility company decided to concentrate on the top 16 performance measures. But it also chose to address a few additional items that were much further down. One of these ranked 43 rd out of 52 and had to do with deposit requirements for commercial customers. A simple change in policy was all that was required to fix a longstanding problem.
|
|
2. Identify the "owner" of each of the performance measures.
|
|
What we usually find is that most measures do, indeed, have an owner. If you go through the entire list, it is usually pretty easy to identify who in the organization would most naturally have responsibility for that area. The team can then organize the Performance Measures into groups, according to ownership (e.g. "These belong to manufacturing, these belong to product design, these to marketing, these to corporate communications, these to R&D, these to engineering," etc.). What is more interesting, of course, are the ones that don't have a clear owner. If they don't, they will probably never be addressed. So the first task is to identify an owner, and charge that person with clear responsibility for that measure. For example, a company needed a sophisticated IT-related capability for their new building control system product. But the IT capability did not fall squarely into either the hardware or software development camps. So this company chose to assign it to an independent part of the organization in order to make sure the IT capability received the priority it deserved.
|
|
If the owners of these measures are already members of the QFD team, there is little more that needs to be done. Because they have been an integral part of the debate and discussion which helped to build the House, they already understand what the customer needs are, what the measures are about, and probably have several good ideas about how to move them in the desired direction. But if they have not been "in the room," then someone from the QFD team needs to communicate these things to them. The good news is that this is usually a positive task for all concerned. A group of team members visits the manager, explaining that the manager's area of responsibility has been identified as critical to the new product's success. The team then explains what they think needs to be done, usually a pretty flattering conversation.
|
|
|
|
|
3. Conduct a thorough analysis of each of the measures.
|
|
This step, which my firm calls Performance Measure Analysis, or PMA, can be carried out by one individual, by several individuals each working on a subset of the measures, or by small teams each attacking a subset. For each measure, a set of questions needs to be answered using the team members' best judgment whenever the answers are not readily available (which is usually the case). The questions are:
• Who owns the measure? This is the same step as described in #2 above.
• What is the current value of the measure?
• What should be the "target value" for the measure? This often requires some additional work such as benchmarking, reverse engineering, or additional market research. At this stage, it is okay to estimate.
• What can be done to move the measure toward the target value? Most QFD's generate dozens of potential ideas and solutions, and they need to be captured and catalogued. This is the place to do it.
• What resources would it take in both time and money to move the measure? Some are fast and easy, while others would take many man years of costly R&D, with still no guarantee of success. Again, it is okay to "guesstimate" these parameters, as most will lack any definitive answer at this point.
• What would the likely impact be on our cost per unit to include the kind of feature or solution required to move the measure? And what would it do to the selling price that the customer would have to pay? Ultimately, the financial folks will want to know how this measure would impact projected sales volume vs. the incremental cost. And while it is probably premature to estimate this, you've got to start thinking along those lines.
|
4. Do a formal cost-benefit analysis.
|
|
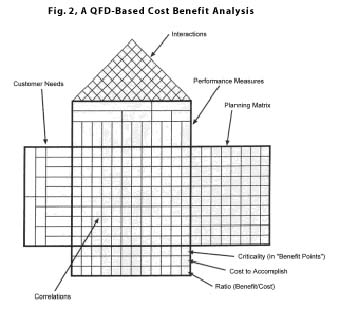
By far, the most creative use of a House of Quality matrix is to actually use the above PMA data to perform a rigorous cost-benefit analysis. The calculation that is performed upon completion of the House of Quality matrix is simply a large weighted sum that produces a number at the bottom of each column (usually referred to as the Criticality or Technical Importance Score). These numbers are expressed in undefined units which are often called "utilities" or "benefit points." Their magnitude represents the relative importance of each of the Performance Measures, i.e., the benefit to be gained from moving that measure significantly in the desired direction.
|
|
By simply calculating the ratio of that benefit vs. the associated cost, it is possible to come up with a true costbenefit analysis. The units will be in the form of "benefit points per thousand dollars." And although this might fall short of the kind of ROI calculations the financial people would prefer, it helps the development team to weigh exactly which measures are most deserving of their limited product development dollars and which to avoid, taking into account all of the trade-off's between the "low hanging fruit" and the big tough technological problems. (See Figure 2) For example, suppose that one measure, if improved upon, would deliver 8000 of these "benefit points," but would cost $4m (and 2 years of engineering design work) to deliver. Another far less important measure would only deliver 1500 "benefit points," but could be done for $500k (and only 6 months to implement). The ratios (2.0 vs. 3.0) tell a far different story than the "benefit points" alone (8000 vs. 1500) and could help the development team to weigh the trade-off's and prioritize their efforts. Then, the timing estimates can be used to determine which features to include in an initial release or first version of the product or service and which to include in subsequent generations. For instance, a leading medical device manufacturer used just such an analysis to determine its funding priorities in a way that balanced some of their long-term "basic science" R&D efforts against some of the more immediate (and do-able) engineering and software development projects. Their plan now is to introduce their next generation product in three distinct phases, with some of the new and more advanced functionality only being made available in Versions 2 and 3.
|
|
|
|
|
To be sure, QFD will probably always be viewed as a complicated and tedious exercise, despite its obvious worth. But teams should not feel that they will be viewed as quitters if they stop after a single House of Quality. Nor should they be made to feel that they have somehow "petered out" because they're not sure what to do after they've finished their first matrix. Much of what needs to be done at that point is fairly obvious to the team members. And by carrying out some of the analyses suggested above, they can convey what they have learned to the rest of the organization, justify the development priorities they have chosen, and move ahead with confidence and a sense of continuing momentum. |
|
|
|
|
|